


Data, data, data. One of the most unexpected turns in my career has been my move into data analysis & storytelling, even helping others to make data-informed decisions & strategic planning. The further I progress in my career, the more important this has become. Certainly, systems have become far more sophisticated than those I encountered when I first dove into online higher ed curriculum development, many years ago—What? A decade now? At my previous institution & job, I grew familiar with data visualization platforms like PowerBI, beyond just what could be done with Excel sheets. Don’t get me wrong, Excel remains a pretty great choice for those first dabbling in data visualization, creating line & bar graphs, pie charts, etc., so it’s an excellent place to start. And, today, with all of the Big Data visualization tools offered through social media, using Twitter Analytics, Google Analytics, etc., the layperson wanting to get an education in using data already has at the ready copious options if one only explores. I suppose that were I to push myself further I could learn to build the dashboards & reports, myself, in Tableau or PowerBI, but thankfully there are many systems in place that already provide visualizations, not to mention that most colleges & universities have substantive institutional research (IR) departments which support leadership with reporting & dashboards.
The trick is that most PhD programs preparing future faculty don’t really prepare those going into academe for the realities of today’s higher ed landscape. Tenure-track jobs are disappearing, & as the pandemic pointed out quite painfully for many institutions many brick-&-mortar schools have delayed investing in online education & institution-wide data visualization tools. Unless one has majored in a field that requires statistical analysis & data analytics, then many higher ed administrators have a steep learning curve in understanding how to read & interpret reports & dashboards.
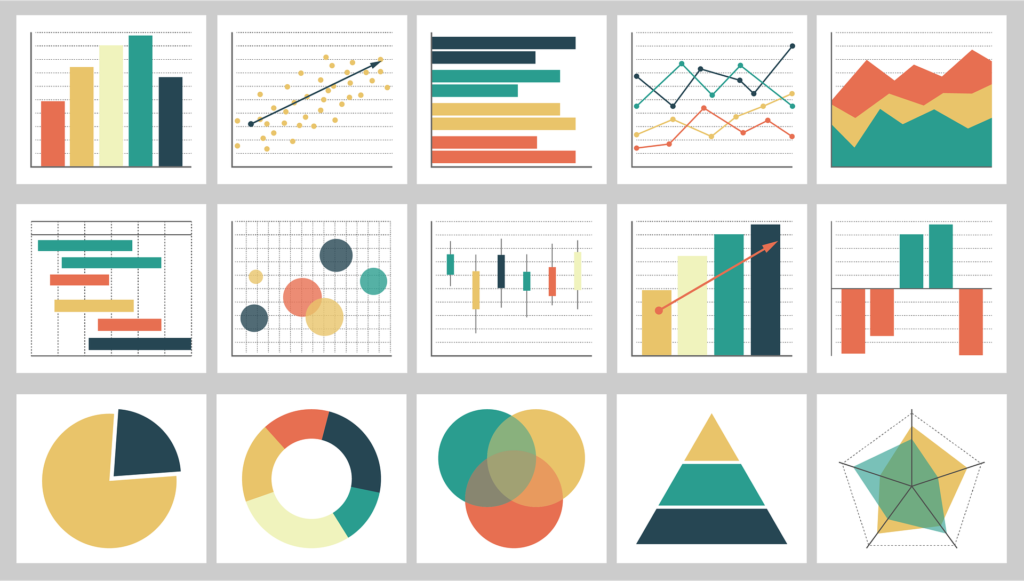
For example, above, you can see a variety of images that depict data in various forms. Yet, there are fundamentals to understanding data that require basic answers. The most important aspects of data visualizations have to do with things like appropriate labels, starting axes at zero, defining the N-value, using scale in accurate ways that do not mislead, providing parameters, just to name a few. You’d be surprised how many of these things can easily be ignored & how many people, even higher-up leaders, lack the awareness to even ask. Scholar Daniel Kahneman argues, “…individuals too often use ‘gut instincts’ to reach speedy conclusions when reading graphics. The fallacy of this ‘fast thinking’ is that the survival process looks only at the information at hand and does not actively look for additional information. Fast thinking accounts for different understandings by how vividly data points appear in one’s mind and not according to their objective importance.” In other words, when people encounter data that create reactions in the reader/viewer, the gut instinct is to make assumptions & jump to conclusions, even potential solutions to perceived problems, before the data have even been properly consumed. Getting others to slow down, even getting myself to slow down, can be a great challenge. And it strikes me as strange how easily annoyed people can become when one asks basic questions like those above to define a data set.
As an introvert & strategic thinker, I find I can lack the natural charisma others possess, as I require quiet & solitude to dig into data, which means I’m useful for preparing data but not as exciting in presenting it. So, I’m having to accept certain limitations of my personality & preferences in order to perform work I actually enjoy. And I seem to understand this as a gamer who enjoys pen-&-paper RGPs, in playing PCs who have high intelligence & skills like hacking or research; yet, in my life, I struggle sometimes to accept that I’m not the high charisma face person of a team or group. It’s really absurd because I would become overly exhausted from too much attention & wouldn’t even enjoy being front & center.


As I explore & complicate my own thinking about data & even myself, I’m finding that radical acceptance can be a true gift. The surrounding world right now seems to be one of constant churn. I read on CNN that 10M people willingly left their jobs in April alone, & people want change in general. SHRM predicts a “turnover tsunami,” citing studies that estimate that 1/2 of workers are predicted to look for new jobs this year, & I’ve been witnessing a lot of job title changes popping up in my LinkedIn newsfeed. Prior to the pandemic, I understood the concept of ennui, but I didn’t fully take in its meaning. There’s also this added sense of urgency due to the understanding that life is indeed short, & social distancing & quarantining measures have affected everyone. I imagine there will be studies to come in decades ahead about the generation to which my four-year-old son belongs. He was home all the time for two months when social issues started to spring up, prompting an evaluation with the pediatrician. We found that the effect of not being around other children appeared more dire than the risk of exposure to the COVID-19 virus itself. Coming out of a chaotic time of insurgence, a contentious election, staggering losses due to the virus, mental health effects of quarantining, & being faced with either dull monotony or risk of death, people are all over the map. As I try to fathom all of these contributing factors, I can start to see why I find solace in the numbers, in the data, in the analyses.
Perhaps I pursued a life of research not only due to a love for learning but also a need for control & sense-making? I think, maybe. If I could focus on the knowable things, use strategies to find patterns & sense in batches of data & scholarship, then I could distract myself from the things that unsettle me. Studying, reading, thinking, puzzling, learning, researching, analyzing, writing, reflecting—any mental activity that could help me find ways to organize & find a sense of reason in the world—have helped me when I’ve been in periods of chaos in my life, as like in a topsy-turvy piece of fiction. Like Alice plummeting down the rabbit hole, I dive down into those numbers & facts, finding things “curiouser & curiouser.”
I have to admit to a bit of discomfort reading about statistics and data analysis. I think I’m allergic!
So many problems caused by the covid thing. Too much data for my brain or laptop to handle.
I’m kind of like you, finding comfort in numbers and data. Thank you for sharing.